chris wrote:It could be an interesting alternative to a Type 25.
Now that engine in a Legacy Spec B...
That's true, Chris. I'd be interested to see how the driving experience stacks up.
chris wrote:It could be an interesting alternative to a Type 25.
Now that engine in a Legacy Spec B...
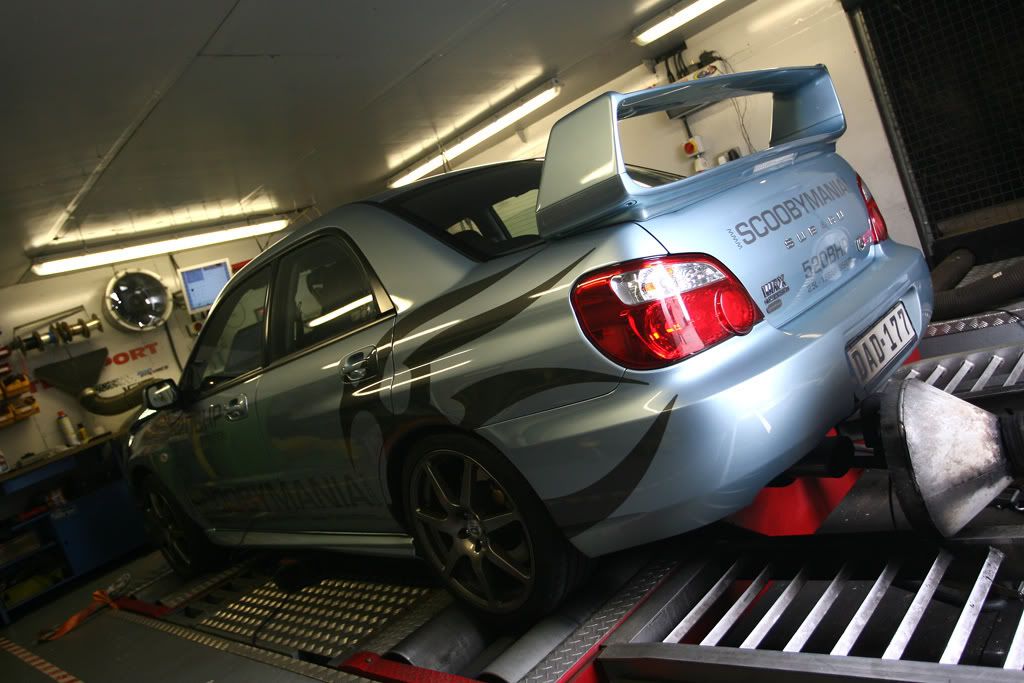
Torrekens wrote:I quite like those alloys.
Why did you bother with changing the looks in fact ? You should just have done the works on getting power up and weight down.
ScoobyMania wrote:Hi chaps,
Been a very busy over the last couple of days - but will be on later with some graphs and maybe a few more pics
 I can't wait...

danr55 wrote:sounds good.
are you up for bringing it to cheltenham on saturday for us all to drool over? we have a meet there
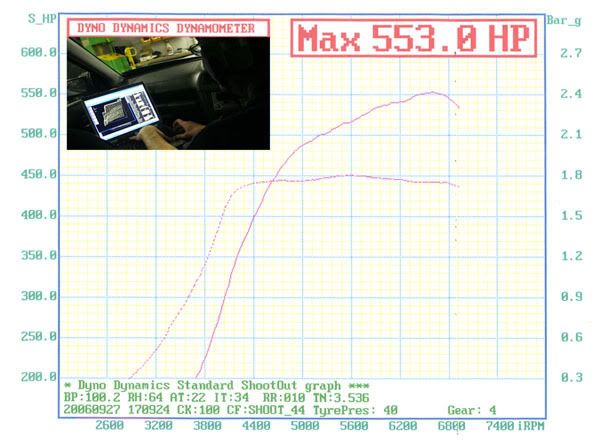

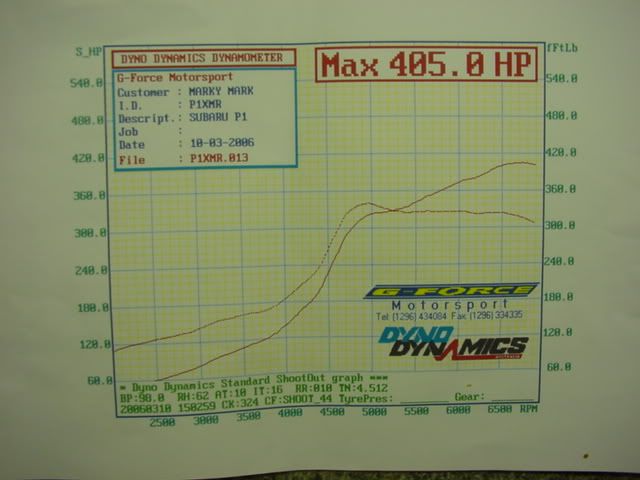
marky mark wrote:Thanks for that Scoobymania. the power curve is impressive - and its a no-brainer that any car with 520 ft'lb is going to pull tree stumps up
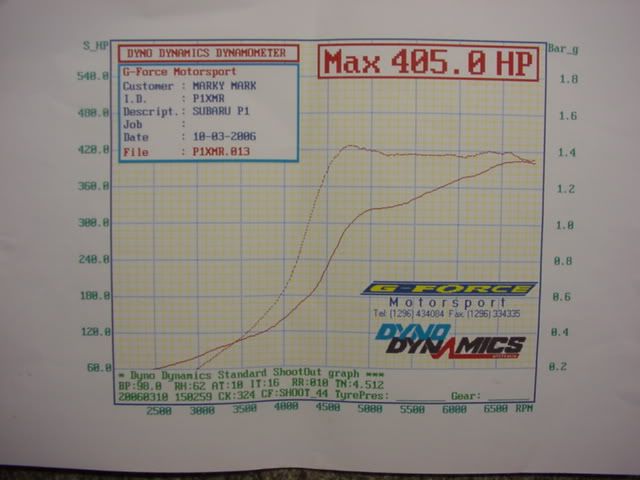
Given the strong boost curve though, if it was my car i would be a bit dissapointed in the torque curve as it hits a brick wall- a 120 ft'lb drop given the flat boost curve is normally a sign that the turbo is not working quite as effeciently as i would have hoped.
I struggle to believe that a GT35 is running out of puff though so have you any thoughts why this is? Maybe at higher revs the relatively low advance you will be running on 95 is killing it a bit?
marky mark wrote:Are you still on the standard 6 speed? Cant remember a car with this amount of torque that does not run either an uprated gear set or a Modena box.
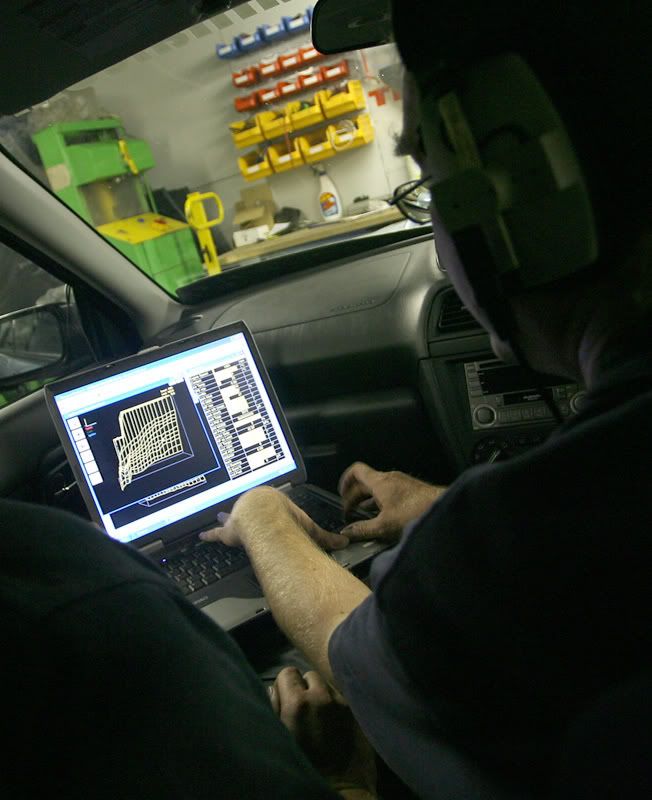
marky mark wrote:I assume as is Steve Simpsons norm its mapped on the rollers exclusively and not finished off on the road. Not that i would fancy mapping a 550 BHP car on the road
marky mark wrote:Headline figures it has to be said are superb and a credit to you
WR1 Bro wrote:Love it. Please keep us posted with any developments. Some of us can't manage the technical commets like Marky Mark but we can still drool over the pics
danr55 wrote:agreed, this reall is impressive, and some nice picsincase you hadnt already noticed we LOVE pics here

how about coming along to cheltenham on Saturday ?
ScoobyMania wrote:danr55 wrote:agreed, this reall is impressive, and some nice pics
how about coming along to cheltenham on Saturday ?
Unfortunately it looks like we are a little pushed for time this Saturday. Do you have any more details on the meet, or any other meets coming up?
ScoobyMania wrote:
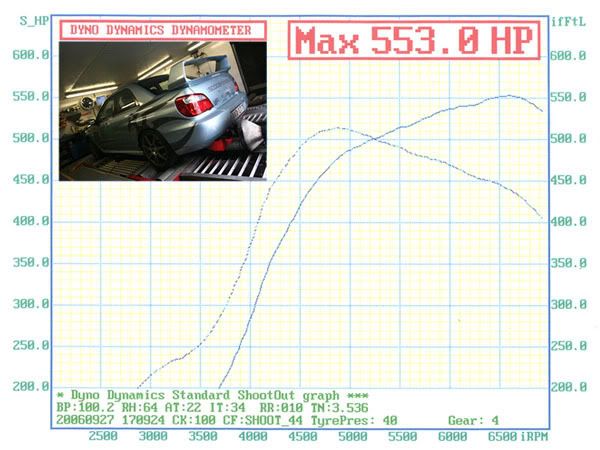
I'm surprised you say that Mark, we have hundreds and hundreds of dyno graphs here (from bikes to Nascars!). More importantly every Scoob dyno graph that is posted on any bbs is downloaded and filed with relative notes. Whether it be a 2ltr vf35 or 2.5ltr gt40, we have it. Of particular interest are (obviously) Dyno Dynamics graphs, especially when they have used rpm pickup coupled with the right ratios/temps/humidity etc. With a modification list (and a little background knowledge) they can be extremely informative. With this in mind I have yet to see a graph that exhibits a torque curve like our WR1.
A few examples (All Dyno Dynamics in shootout mode):
2.2ltr peaking @ 500lbft @ 5400rpm, dropping to 300lbft @ 7500rpm = 200lbft loss over 2100rpm. 40% decrease
2.5ltr peaking @ 480lbft @ 4400rpm, dropping to 320lbft @ 6600rpm = 160lbft loss over 2200rpm. 33% decrease
2.5ltr peaking @ 435lbft @ 4800rpm, dropping to 315lbft @ 6400rpm = 120lbft loss over 1600rpm. 28% decrease
2.0ltr peaking @ 500lbft @ 5400rpm, dropping to 360lbft @ 7000rpm = 140lbft loss over 1600rpm. 28% decrease
2.5ltr peaking @ 550lbft @ 4400rpm, dropping to 410lbft @ 6200rpm = 150lbft loss over 1800rpm . 26% decrease
Our 120lbft loss over 2100rpm (23% decrease) looks pretty good I thinkOne other thing to note is that in on the latter runs we were making peak power @ 6800, not 6600 as this graph shows.

Dont like this as i dont know who i am speaking to now but i am presuming its Steve S?
STI5 cams and heads, heads ported/flowed and combustion chambers reworked by myself. Bit of work in the cases by myself, a lot of attention to heat managment and Ecutek mapped by sir Bob of Rawle.
The turbo is actually almost identical to one your good selves (scoobymania) sell (in fact i suspect it maybe the same )
It is actually mapped for 1.5 which it achieves (plus a bit more) on the road no problem but did not do on the RR. It is my daily driver and i do drive it hard and i dont wish for any more boost with still relatively weak pistons.
Plus the missus takes it to work now and again and she cant be trusted

With this in mind I have yet to see a graph that exhibits a torque curve like our WR1.
 ) due to running out of airflow on the smaller 30R. It spools around 4-500rpm earlier but the 35R holds on for another 1000rpm.
dougie549 wrote:Need some help understanding these graphs and "real world", on the road performance.
Been reading about people talking about "area under the curve" when they talk about how quick a car is.
AlanG's has 500Ib ft over a 1500rpm span and 450Ibft over a 2100rpm span. The Scoobymania car has an area "under the curve" of 500Ib ft for only 600rpm and 450Ib ft for just over 2100rpm.
Would the car with the greater "under the curve" graph not be quicker on the road even though it's got less peak power?
marky mark wrote:dougie549 wrote:Need some help understanding these graphs and "real world", on the road performance.
Been reading about people talking about "area under the curve" when they talk about how quick a car is.
AlanG's has 500Ib ft over a 1500rpm span and 450Ibft over a 2100rpm span. The Scoobymania car has an area "under the curve" of 500Ib ft for only 600rpm and 450Ib ft for just over 2100rpm.
Would the car with the greater "under the curve" graph not be quicker on the road even though it's got less peak power?
Basically Bob thats correct. Torque is all about pulling - i.e the thump in your back most noticeable when you floor it from say 3500 RPM.
If you floor (or exit a corner) anywhere in that in Alan Garrod's car in that wide span it will pull and accelerate a tad faster than the scoobymania car.
At this level and with these high numbers the difference will be negligible mind you.
Ultimately its BHP that defines how quick a car is, but if its all pushed up high in the rev range it requires more driver skill to keep it on the boil. For road use a good spread with minimal drop off is king.
this is why its a bit 'false' to look at headline figures. Look at the graphs you get from one well known tuner and their kits based around APS stuff and you will see a good early peak but then its like falling off a cliff.
